GIS TD3: Qgis - georeferencing
Requirement
Check that the Georeferencer plugin is installed. It should be under Raster/Georeferencer.... If not, open Plugins/Manage and Install Plugins.... Search for Georeferencer and check the box next to the plugin.
Introduction
The aim of this tutorial is to tranform the image below into data that can be used in Qgis.
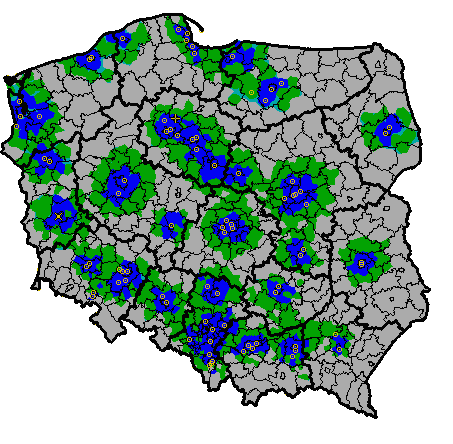
The image represents the signal quality of a given TV network in Poland. Blue is 'high quality' signal, green is 'low quality' signal, grey is no signal at all. Small yellow circles are antennas and dark lines are administrative limits.
We want to extract the filled colors so that it can be used to compute zonal statistics at the municipality level.
Preprocesssing
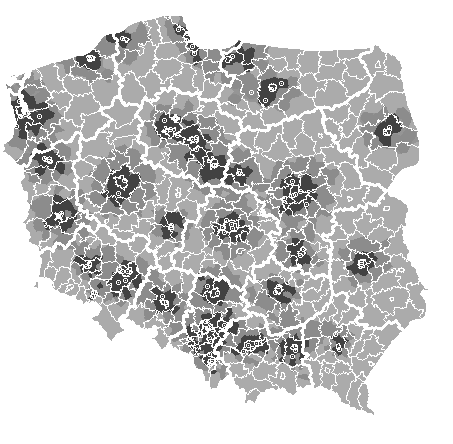
As a first step, I removed the boundaries, antennas. I finally transformed the image as a black and white for simplicity. I did this using the software Gimp but it would also be feasible in Qgis with the same techniques that we will use today. It will simply save us a bit of time.
Roadmap
- Georeference the image using the Georeferencer plug-in
- open
rawdata/admin.shpin a new project - open the Georeferencer plug in with
Layer/Georeferencer... - open
rawdata/tv.pngby cliking on
- Click on the raster and then click on the corresponding location on the canvas
- Once you have enough points, open the settings by clicking on
 , set a transformation type, save the output raster and the cgp points. Run the algorithm by clicking on
- Now load
rawdata/tv_grey_no_boundaries.pngand import the cgp points you created by clicking on
- Rerun the alogrithm and this pre processed raster
- open
By selecting a raster layer, you can see the values of a given pixel by clicking on  and then clicking on the relevant pixel it on the canvas.
- Fill the transparent pixels
- Check the value of Band 1 of the transparent pixels
- Transform the transparent pixels as missing values, using
gdal:translateand using the value above - Fill the data using
gdal:fill_nodata
At this step, the data should look similar to:
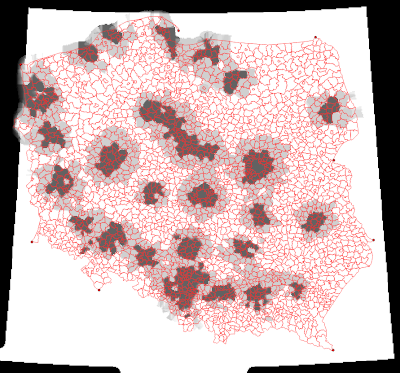
- The next step is to create separately for each signal quality a new raster where a pixel is equal to 1 if and only if the value correspond the given level.
- Open the raster calculator with
Raster/Raster calculator... - Check the pixel values for each reception level and use a formula of the form
"filled@1" < val. ⚠️ Because of the interpolation of the missing data, the raster contains values between these bounds. You need to choose thresholds accordingly.
- Open the raster calculator with
- Use the zonal statistics algorithm as a batch process to create three new columns that contain the share of the municipality that receive each signal quality.
- Export the features as a
.csvfile by right clicking on the layer in layer panel and thenExport/Save features as...